Tuesday, February 18, 2020
Lupine Publishers: Lupine Publishers: Lupine Publishers | The Prevent...
Lupine Publishers: Lupine Publishers: Lupine Publishers | The Prevent...: Lupine Publishers: Lupine Publishers | The Prevention and Treatment o... : Lupine Publishers | Open Access Journal of Complementary & A...

Sunday, February 2, 2020
Epidemiology of Osteoporosis in Patients with Type 1 Diabetes Mellitus
Abstract
Background and Objective: The incidence of type 1 diabetes is increasing. Osteoporosis has become an alarming health problem throughout the entire world. The aim of this study were to estimate the epidemiology of osteoporosisamong Saudi patients with T1DM, living in the western province, attending the diabetes centre at King Fahd Armed Forces Hospital, Jeddah, KSA.
Methods: Eligible patients were older than 12 years old, had T1DM . All patients were recruited from the population of the Diabetic Centre at King Fahad Armed Forces Hospital. Eligible patients met with investigators for a complete history and physical examination, to have baseline laboratory assessments including glycosylated haemoglobin (HbA1c). HbA1c was expressed as percentage and measured using the high-performance liquid chromatography. BMD in the current study was measured using The Lunar Achilles (In Sight, GE Healthcare, USA), which is a proven bone ultrasonometer to avoid exposing the children to unnecessarily ionizing radiation. All measurements were converted to Z-scores using a data bank for age-matched speed of sound values supplied by the manufacturer. We excluded patients with a history of fractures of less than 1 year and those with associated bone/joint problems, liver disease or patients on long-term steroid therapy
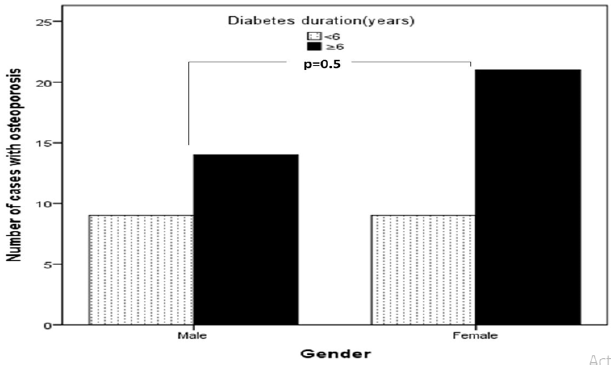
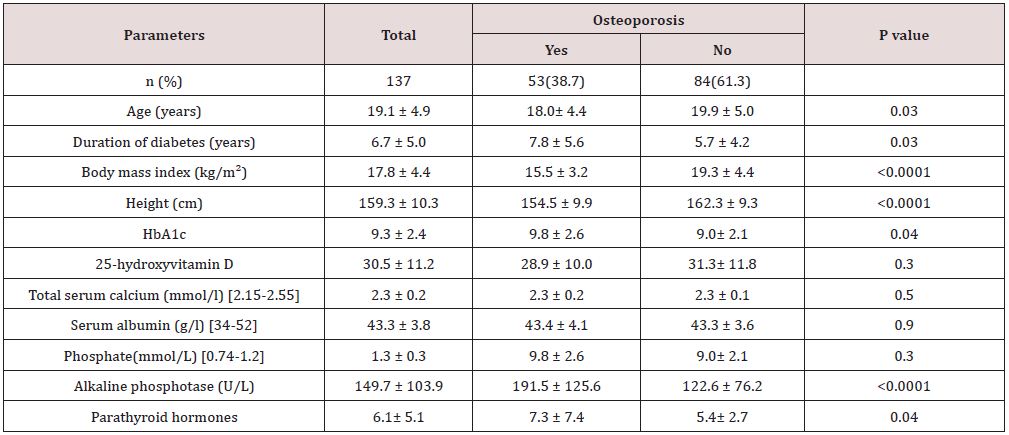
Main results: 137 patients completed the study. There were 60 (44%) male and 77 (56%) were female with mean age 19.1±4.9. Osteoporosis was found in 53 of cases (38.7%) of patients. There were 23 (43.4%) male and 30 (56.6%) were female giving a female to male ratio 1.3:1. Osteoporosis was found in 53 of cases (38.7%) of patients. Baseline characteristics are shown in Table 1. Patients with osteoporosis were significantly younger, longer diabetes duration and have higher HbA1c than patients without osteoporosis. Osteoporosis was higher in females than male and was seen more in cases with HbA1c > 9.0 as compared to HbA1c groups of < 8.0 and 8-9, (Figures 1 & 2). Cases with longer diabetes duration (≥6years) have nonsignificant more frequent osteoporosis than cases with diabetes duration < 6 years, 34% vs. 66% respectively, p=0.4. There were no significant differences between genders and frequency of osteoporosis in relation to diabetes duration.
Conclusion: Our findings demonstrate lower BMD in young women with type 1 diabetes. Although bone density testing is not routinely performed in young women, these data suggest that screening may be important in young women with type 1 diabetes. In addition, these women should be counseled regarding lifestyle interventions that may improve bone health, including adequate intake of calcium and vitamin D, and exercise.
Introduction
Type 1 diabetes mellitus (T1DM) results from a cellularmediated autoimmune destruction of the β-cells of the pancreas [1]. T1DM accounts for about 10% of all diabetes, affecting approximately 1.4 million people in the U.S, and 10-20 million globally [2]. The prevalence of T1DM was 0.193% in the Saudi males and 0.237% in the Saudi females [3] Osteoporosis has become an alarming health problem throughout the entire world, and approximately 200 million people in the world are threatened by this deleterious disease [4,5]. Osteoporosis is often described as a silent disease because it is typically asymptomatic until a fracture occurs [6]. Along with increased risk of complications including retinopathy, nephropathy, neuropathy, and cardiovascular events, adults with type 1 diabetes have decreased bone mineral density (BMD) compared with control subjects [7,8]. In fact, osteoporosis is the most significant metabolic bone disease in individuals with diabetes [9]. Patients with diabetes are at risk for osteoporosis and its complications, including hip fracture [10]. Recent studies demonstrate that diabetes is associated with alterations in bone health in children and adolescents [6,11-13]. These observations suggest that adverse effects on bone health may occur early after the diabetes diagnosis. This study was undertaken to estimate the epidemiology of osteoporosis among Saudi patients with T1DM, living in the western province, attending the diabetes centre at King Fahd Armed Forces Hospital, Jeddah, KSA.
Methods
Eligible patients were older than 12 years old, had T1DM. All patients were recruited from the population of the Diabetic Centre at King Fahad Armed Forces Hospital. All the patients gave their or their guardian informed consent prior to their inclusion. Eligible patients met with investigators for a complete history and physical examination, to have baseline laboratory assessments including glycosylated hemglobin (HbA1c). HbA1c was expressed as percentage and measured using the high performance liquid chromatography. BMD in the current study was measured using The Lunar Achilles (Insight, GE Healthcare, USA), which is a proven bone ultrasonometer to avoid exposing the children to unnecessarily ionizing radiation. All measurements were converted to Z-scores using a data bank for age-matched speed of sound values supplied by the manufacturer. We excluded patients with a history of fractures of less than 1 year and those with associated bone/joint problems, liver disease or patients on long-term steroid therapy.
Statistical Analysis
Univariate analysis of baseline and follow up demography and clinical laboratory endpoints were accomplished using unpaired t-test where appropriate. Chi square(X2) test were used for categorical data comparison. All statistical analyses were performed using SPSS Version 22.0. All P values were based on two-sided tests. The difference between groups was considered significant when P<0.05.
Results
Baseline characteristics are shown in table 1. 137 patients completed the study. There were 60 (44%) male and 77 (56%) were female with mean age 19.1±4.9 (minimum=12, maximum = 37) years. Osteoporosis was found in 53 of cases (38.7%) of patients. There were 23 (43.4%) male and 30 (56.6%) were female giving a female to male ratio 1.3:1. Patients with osteoporosis were significantly younger, longer diabetes duration and have higher HbA1c than patients without osteoporosis. Osteoporosis was higher in females than male and was seen more in cases with HbA1c > 9.0 as compared to HbA1c groups of < 8.0 and 8-9, (Figures 1 & 2). Cases with longer diabetes duration (≥6years) have nonsignificant more frequent osteoporosis than cases with diabetes duration <6 years, 34% vs. 66% respectively, p=0.4. There were no significant differences between genders and frequency of osteoporosis in relation to diabetes duration (Figure 3).
Figure 1: Percentage of cases of type 1 diabetes mellitus associated with osteoporosis in relation to gender.
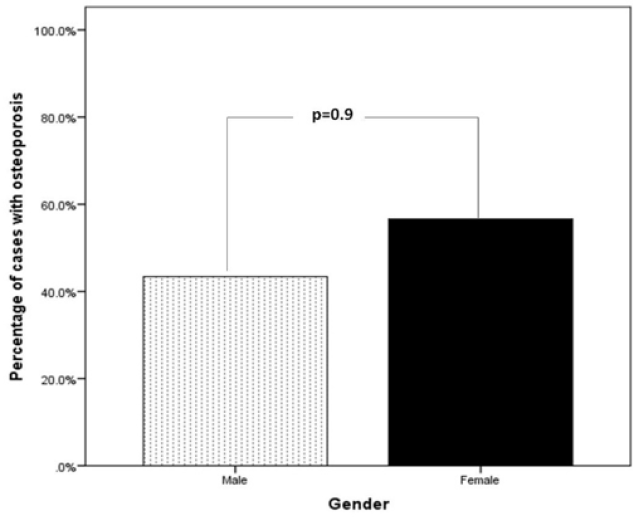
Figure 2: Number of cases of type 1 diabetes mellitus associated with osteoporosis in relation to HbA1c groups.
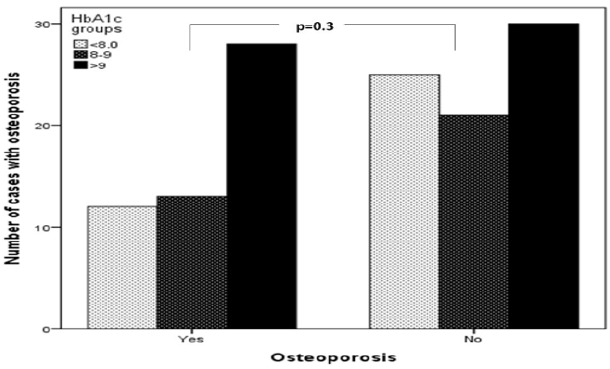
Figure 3: Number of cases with type 1 diabetes mellitus associated with osteoporosis in relation to diabetes duration (years).
Discussion
In agreement with many studies, the present study has confirmed that osteoporosis is associated with T1DM.
[14-16] However, it was unclear until recently whether this translated into increased fracture rates. A number of studies have shown that poor glycemic control in patients with T1DM is associated with osteopenia and osteoporosis [17,18]. Poor glycemic control for long period of time can result into microvascular complications and can aggravate the loss of bone density by various mechanisms. Nephropathy can predispose patients with diabetes to hypercalciuria and can alter the vitamin D metabolism causing vitamin D deficiency [19,20]. Hyperglycemia may lead to an increased loss of calcium in the urine, which can in turn cause a negative calcium balance [21]. Furthermore, use of loop diuretics in patients with diabetic nephropathy is associated with low bone mineral density (BMD) as these drugs cause the renal excretion of calcium [22]. Insulin-like growth factors and other cytokines may influence diabetic bone metabolism [20]. The decrease bone formation and inadequate accrual peak bone mass in children with prepubertal onset T1DM has been proposed as a major contributing factor for low bone strength and osteoporosis in later life [23]. Men with T1DM tend to be particularly prone to osteopenia or osteoporosis compared to women of similar ages [15,24,25] Estrogen adequacy and/or use of estrogen based oral contraceptive pills might be the reason for higher bone mass in women compared to men [25-26]. Furthermore, hypogonadism is quite common in men with T1DM and that may contribute to osteoporosis in males [27,28]. Another factor which may influence the BMD is body mass index (BMI). Studies have shown that lower BMI is associated with higher incidence of osteoporosis. The adipose tissue, apart from providing mechanical loading, also increases BMD through the activity of adipocytokines. Patients with TIDM also have a negative calcium balance as a result of hypercalciuria during periods of hyperglycemia, functional hypoparathyroidism, vitamin D deficiency and alterations in vitamin D metabolism [29-31]. In concordance with our results, duration of diabetes seems to play a key role given the lower BMD found among patients who have had diabetes for >5 years. In the Iowa Women’s Health Study, women with type 1 diabetes were 12.25 times more likely to report having had a fracture compared to women without diabetes [10]. A low BMI as shown in our study is associated the increased possibility of osteoporosis [32]. Overweight and obesity are believed to be protective factors of BMD [33,34]. Obesity is strongly associated with higher BMD probably through mechanical loading and hormonal factors including insulin, estragon, and leptin [35] In conclusion, our findings demonstrate high frequency of osteoporosis in young women with type 1 diabetes. Although bone density testing is not routinely performed in young women, these data suggest that screening may be important in young women with type 1 diabetes. In addition, these women should be counseled regarding lifestyle interventions that may improve bone health, including adequate intake of calcium and vitamin D, and exercise Table 1.
Table 1: Characteristics of patients with type 1 diabetes mellitus stratified by presence of Osteoporosis.
Acknowledgment
We are grateful to the staffs from the diabetic centre at King Fahad Armed Forces Hospital for his valuable contributions in data collection. The authors have no conflict of interest to disclose
Thursday, January 30, 2020
Lupine Publishers: Lupine Publishers | Hamstring Injuries in Taekwond...
Lupine Publishers: Lupine Publishers | Hamstring Injuries in Taekwond...: Lupine Publishers | Journal of Orthopaedics Abstract Background: Hamstring injuries frequently occur in sports involving ex...
Friday, January 24, 2020
Socioeconomic Variables Associated with Level of Obesity and Prevalence of Other Diseases Among Children and Adolescents of Some Affluent Families of Bangladesh| Lupine Publishers
Diabetes and Obesity Open access Journals- Lupine Publishers

Abstract
Keywords:Level of obesity; Socioeconomic variables; Significant association between diabetes and level of obesity; Logistic regression
Introduction
The other effects of overweight and obesity are psychological [6], depression [7], physical [8,9]. The early physical effect of obesity in adolescence is noted when it affects all most all the organ which leads to the increase rate of mortality in adulthood [4,10]. The causes of childhood obesity are genetic. Over 200 genes affect weight by determining activity level, food preferences, body type, and metabolism [4]. Family practices such as decreasing rate of breast feed, by mothers, stay home and utilizes electronic devices, less physical activity, food habit, specially, taking more calorie food from restaurant with less fiber [4,9,11], low socioeconomic status [12], eating habit of calorie- rich drinks [13]. However, the problem can be obviated by avoiding the sources of causes of obesity and encouraging the children and adolescents to be involved in physical activities. From the above discussion, it can be concluded that growing level of obesity among children and youth and increasing the rate of prevalence of diabetes are of great concern throughout the world. Many of the complications are silent and often go undiagnosed. The obese children are at high risk for the development of early morbidity. Considering all these aspects discussed above, the objective of the study was planned to observe the joint relationship of level of obesity and prevalence of diabetes including prevalence of other diseases with other socioeconomic factors which were more responsible for the variation in the level of obesity among children and adolescents under 18 years of age coming out from affluent families. The specific objective was to investigate the association of level of obesity of children and adolescents with some social factors. Also, to identify the responsible variable for other diseases.
Methodology
The data were collected through pre-designed and pre-tested printed questionnaire covering the questions related to the demographic characteristics of the children and adolescents of age below 18 years and the questions related to the socioeconomic variables of the parents. The randomly selected students were given written instructions how to collect information and they were requested to help in collecting information from their parents, who were very much concerned about the health hazard of their offspring. The parents of children filled in the questionnaires as some of the children were under 18 years of age and some were even below 10 years. The important collected information was age, height, weight, sex, food habit, time spent, involvement in co-curricular activities, if it is feasible, of the children, and information regarding the prevalence of any other diseases. To study the socioeconomic background of the children, the information regarding parent’s level of education, occupation and income were also collected. For youth having diabetes, the latest blood sugar level measured by registered practitioner or measured in a registered clinic also recorded. Association of level of obesity of offspring with families’ socioeconomic background were examined using chi-square test, where significant association was concluded when p-value ≤0.05. Logistic regression model using levels of prevalence of other diseases as dependent variable was fitted.
Result and Discussion
[ χ2 =8.741, p-value = 0.033, Table 1]
Considering the prevalence of diabetes among the obese and severe obese group compared to non-obese group, the former group were 69 percent more exposed to the problem of diabetes [O.R = 1.69]. Their risk ratio was 1.47 compared to non-obese group. Amongst the investigated children 70.2 percent were in underweight group and 9.1 percent were in obese and severe obese group. The level of obesity was measured by the amount of BMI (weight in kg / height in m2). The mean value of BMI was 17.67 with a standard deviation 10.58. The underweight group of children and adolescents had BMI <23. The BMI of other three groups were 23 - <30, 30 - <45 and 45+. The levels of BMI were decided according to the percentile values. This finding was almost similar to that observed in another study [15]. Amongst the observed children and adolescent’s 78.1 percent were in the age group 10 years and above and 70.2 percent of the investigated children and youth were in underweight group and 9.1 percent were obese and severely obese. Majority [ Table 2, 78.2%] of them were in the age group 10 years and above and among them 72.6 percent were in underweight group. In these group obese and severe obese children were 6.9 percent. Major obese and severe obese children (19.4%) were among the children of age 5 to less than 10 years. The differences in the proportions of levels of obesity according to different age groups were significant [ χ2 = 39.043, p- value = 0.000]. The prevalence of obesity and severe obesity among the children of age group 5 to less than 10 years compared to children of other age groups were too high [O.R = 13.06]. Let us investigate the prevalence of diabetes and prevalence of other diseases among the children and adolescents. It was observed that 86.6 percent investigated children had no other health hazard (Table 2) except diabetes. However, 21.2 percent of them were diabetic patients. Among the diabetic patient’s 11.3 percent had eye problem. The major problem among the respondents was eye problem. The percentage of this group of children was 7.6. There were significant differences in the percentages of respondents facing health hazard according to prevalence of diabetes [χ2 = 10.957, p-value = 0.027].
Table 1: Distribution of respondents according to level of obesity
and prevalence of diabetes.
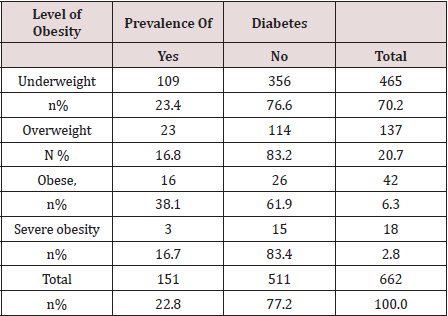
Table 2: Distribution of children according to prevalence of diabetes and prevalence of other diseases.

Now, let us investigate the reason of obesity and severe obesity
among the children and youth. Some of the social factors might
have enhanced the level of obesity. This was noted from the study of
association of different factors and level of obesity. The investigated
children and adolescents were classified into three classes by their
age levels. These three groups of children were again classified by
their level of obesity. The classified results were shown in Table 3.
It was seen that 72.5% children and youth of the age group 10 years
and above were underweight. The proportions of underweight
children of other two age groups were lesser than the percentages
of overall underweight group of children. The children less than 5
years of age had the highest percentage of the overweight group and
this group of children had the 58 percent [O.R.=1.58] more chance of
overweight compared to other groups of children. This differential
in proportions of level of obesity according to age groups was
highly significant [ χ2 = 38.94, p-value=0.000]. Amongst the studied
children 58.2 percent were males (Table 4) and 77.4 percent of
them were underweight. The corresponding figure among females
is 60.3 percent. The differential in obesity by sex differences is
significant [ χ2= 44.03, p-value= 0.00]. Number of children of
different levels of obesity belonging to different residential areas
were presented in (Table 5). It was seen that maximum village
children (76.5%) were underweight compared to urban semiurban
children. Again, among the village children, number of obese
and severe obese groups were lower compared to other groups of
children. The differences in proportion. The information of 72.5%
children were reported from urban area. The corresponding
percentages of rural and semi-urban children were 18 and 9.5. The
classified information of level of obesity and residence of children
were significantly different [ χ2 = 12.45, p-value= 0.04]. Similar
findings were observed in other studies [14,15] It was already
mentioned that the study group of children were mostly living in
city center (72.5%) and though they had the enough scope to be
involved in physical activities like games and sports, still majority of
the children (39.9%) passed their time by watching television and
16.8% slept after or before their academic activities. One-fourth
(26.4%) of the investigated children mentioned that they were
involved in some other activities including games and sports (Table
6). Around 72% severe obese group killed their time by watching
television. The corresponding percentage among obese group is
45.2. The differentials in proportions of utilization of time by the
children of different obese groups were significantly different
as [χ2= 54.12 with p- value = 0.00]. Let us now observe the food
habit of investigated children and adolescent. As the investigating
units were mostly from affluent city residence, they had the scope
to get sufficient foods, with proper hygienic measures. Among the
investigating units’ 47.9 percent were habituated in taking food
from restaurants. Among the obese children 54.7 percent were
habituated in takin restaurant food (Table 7).
Table 3: Distribution of children and adolescents according to their age and level of obesity.
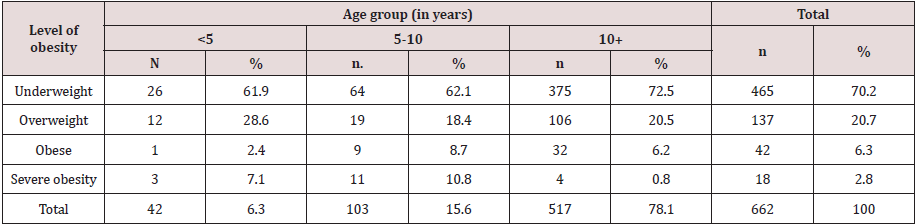
Table 4: Distribution of children according to their gender and level of obesity.

Table 5: Distribution of children according to their residence and level of obesity.
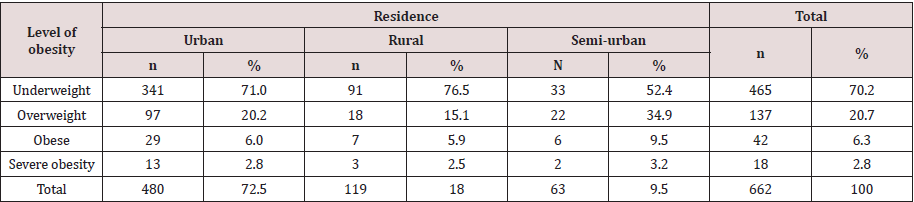
Table 6: Distribution of children according to their utilization of time and level of obesity.
For more Lupine Publishers Open access journals please visit our website
For more Diabetes open access journal please click here
Follow on Linkedin : https://www.linkedin.com/company/lupinepublishers
Follow on Twitter : https://twitter.com/lupine_online
Follow on Twitter : https://twitter.com/lupine_online
Lupine Publishers: Lupine Publishers | Hamstring Injuries in Taekwond...
Lupine Publishers: Lupine Publishers | Hamstring Injuries in Taekwond...: Lupine Publishers | Journal of Orthopaedics Abstract Background: Hamstring injuries frequently occur in sports involving ex...
Lupine Publishers: Lupine Publishers | Hamstring Injuries in Taekwond...
Lupine Publishers: Lupine Publishers | Hamstring Injuries in Taekwond...: Lupine Publishers | Journal of Orthopaedics Abstract Background: Hamstring injuries frequently occur in sports involving ex...
Subscribe to:
Posts (Atom)
Lupine Publishers| Semaglutide versus liraglutide for treatment of obesity
Lupine Publishers| Journal of Diabetes and Obesity Abstract Background: Once weekly (OW) semaglutide is a glucagon-like peptide...

-
 Lupine Publishers| Journal of Diabetes and Obesity Abstract Background: Once weekly (OW) semaglutide is a glucagon-like peptide...
-
Lupine Publishers| Journal of Diabetes and Obesity Abstract A recent study using next-generation RNA sequencing was reported on g...
-
 Stem Cell Therapy in Diabetes Mellitus by Poondy Gopalratnam Raman in Archives of Diabetes & Obesity in Lupine Publishers Di...
