Lupine Publishers| Journal Of Diabetes and Obesity
Abstract
Keywords:Level of obesity; Socioeconomic variables; Significant association between diabetes and level of obesity; Logistic regression
Introduction
The other effects of overweight and obesity are psychological [6], depression [7], physical [8,9]. The early physical effect of obesity in adolescence is noted when it affects all most all the organ which leads to the increase rate of mortality in adulthood [4,10]. The causes of childhood obesity are genetic. Over 200 genes affect weight by determining activity level, food preferences, body type, and metabolism [4]. Family practices such as decreasing rate of breast feed, by mothers, stay home and utilizes electronic devices, less physical activity, food habit, specially, taking more calorie food from restaurant with less fiber [4,9,11], low socioeconomic status [12], eating habit of calorie- rich drinks [13]. However, the problem can be obviated by avoiding the sources of causes of obesity and encouraging the children and adolescents to be involved in physical activities. From the above discussion, it can be concluded that growing level of obesity among children and youth and increasing the rate of prevalence of diabetes are of great concern throughout the world. Many of the complications are silent and often go undiagnosed. The obese children are at high risk for the development of early morbidity. Considering all these aspects discussed above, the objective of the study was planned to observe the joint relationship of level of obesity and prevalence of diabetes including prevalence of other diseases with other socioeconomic factors which were more responsible for the variation in the level of obesity among children and adolescents under 18 years of age coming out from affluent families. The specific objective was to investigate the association of level of obesity of children and adolescents with some social factors. Also, to identify the responsible variable for other diseases.
Methodology
The data were collected through pre-designed and pre-tested printed questionnaire covering the questions related to the demographic characteristics of the children and adolescents of age below 18 years and the questions related to the socioeconomic variables of the parents. The randomly selected students were given written instructions how to collect information and they were requested to help in collecting information from their parents, who were very much concerned about the health hazard of their offspring. The parents of children filled in the questionnaires as some of the children were under 18 years of age and some were even below 10 years. The important collected information was age, height, weight, sex, food habit, time spent, involvement in co-curricular activities, if it is feasible, of the children, and information regarding the prevalence of any other diseases. To study the socioeconomic background of the children, the information regarding parent’s level of education, occupation and income were also collected. For youth having diabetes, the latest blood sugar level measured by registered practitioner or measured in a registered clinic also recorded. Association of level of obesity of offspring with families’ socioeconomic background were examined using chi-square test, where significant association was concluded when p-value ≤0.05. Logistic regression model using levels of prevalence of other diseases as dependent variable was fitted.
Result and Discussion
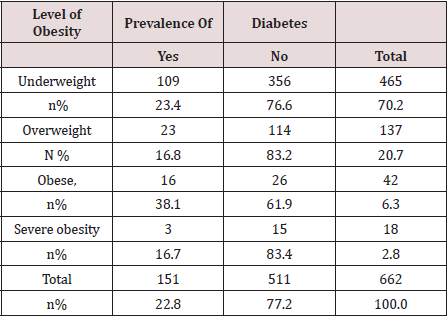
[ χ2 =8.741, p-value = 0.033, Table 1]
Considering the prevalence of diabetes among the obese and severe obese group compared to non-obese group, the former group were 69 percent more exposed to the problem of diabetes [O.R = 1.69]. Their risk ratio was 1.47 compared to non-obese group. Amongst the investigated children 70.2 percent were in underweight group and 9.1 percent were in obese and severe obese group. The level of obesity was measured by the amount of BMI (weight in kg / height in m2). The mean value of BMI was 17.67 with a standard deviation 10.58. The underweight group of children and adolescents had BMI <23. The BMI of other three groups were 23 - <30, 30 - <45 and 45+. The levels of BMI were decided according to the percentile values. This finding was almost similar to that observed in another study [15]. Amongst the observed children and adolescent’s 78.1 percent were in the age group 10 years and above and 70.2 percent of the investigated children and youth were in underweight group and 9.1 percent were obese and severely obese. Majority [ Table 2, 78.2%] of them were in the age group 10 years and above and among them 72.6 percent were in underweight group. In these group obese and severe obese children were 6.9 percent. Major obese and severe obese children (19.4%) were among the children of age 5 to less than 10 years. The differences in the proportions of levels of obesity according to different age groups were significant [ χ2 = 39.043, p- value = 0.000]. The prevalence of obesity and severe obesity among the children of age group 5 to less than 10 years compared to children of other age groups were too high [O.R = 13.06]. Let us investigate the prevalence of diabetes and prevalence of other diseases among the children and adolescents. It was observed that 86.6 percent investigated children had no other health hazard (Table 2) except diabetes. However, 21.2 percent of them were diabetic patients. Among the diabetic patient’s 11.3 percent had eye problem. The major problem among the respondents was eye problem. The percentage of this group of children was 7.6. There were significant differences in the percentages of respondents facing health hazard according to prevalence of diabetes [χ2 = 10.957, p-value = 0.027].
Table 2: Distribution of children according to prevalence of diabetes and prevalence of other diseases.

Now, let us investigate the reason of obesity and severe obesity
among the children and youth. Some of the social factors might
have enhanced the level of obesity. This was noted from the study of
association of different factors and level of obesity. The investigated
children and adolescents were classified into three classes by their
age levels. These three groups of children were again classified by
their level of obesity. The classified results were shown in Table 3.
It was seen that 72.5% children and youth of the age group 10 years
and above were underweight. The proportions of underweight
children of other two age groups were lesser than the percentages
of overall underweight group of children. The children less than 5
years of age had the highest percentage of the overweight group and
this group of children had the 58 percent [O.R.=1.58] more chance of
overweight compared to other groups of children. This differential
in proportions of level of obesity according to age groups was
highly significant [ χ2 = 38.94, p-value=0.000]. Amongst the studied
children 58.2 percent were males (Table 4) and 77.4 percent of
them were underweight. The corresponding figure among females
is 60.3 percent. The differential in obesity by sex differences is
significant [ χ2= 44.03, p-value= 0.00]. Number of children of
different levels of obesity belonging to different residential areas
were presented in (Table 5). It was seen that maximum village
children (76.5%) were underweight compared to urban semiurban
children. Again, among the village children, number of obese
and severe obese groups were lower compared to other groups of
children. The differences in proportion. The information of 72.5%
children were reported from urban area. The corresponding
percentages of rural and semi-urban children were 18 and 9.5. The
classified information of level of obesity and residence of children
were significantly different [ χ2 = 12.45, p-value= 0.04]. Similar
findings were observed in other studies [14,15] It was already
mentioned that the study group of children were mostly living in
city center (72.5%) and though they had the enough scope to be
involved in physical activities like games and sports, still majority of
the children (39.9%) passed their time by watching television and
16.8% slept after or before their academic activities. One-fourth
(26.4%) of the investigated children mentioned that they were
involved in some other activities including games and sports (Table
6). Around 72% severe obese group killed their time by watching
television. The corresponding percentage among obese group is
45.2. The differentials in proportions of utilization of time by the
children of different obese groups were significantly different
as [χ2= 54.12 with p- value = 0.00]. Let us now observe the food
habit of investigated children and adolescent. As the investigating
units were mostly from affluent city residence, they had the scope
to get sufficient foods, with proper hygienic measures. Among the
investigating units’ 47.9 percent were habituated in taking food
from restaurants. Among the obese children 54.7 percent were
habituated in takin restaurant food (Table 7).
Table 7: Distribution of children and adolescents according to their food habit and level of Obesity.

In a separate study [15] it was reported that the increasing
trend of obesity was associated with fast food from restaurant.
Of course, higher proportions of underweight (46.9%) and
overweight group of children (53.3%) were habituated in taking
restaurant food. However, the differentials in proportions of
children taking restaurant food according to different levels of
obesity were significant [ χ2 = 94.63 with p-value = 0.00]. Usually
the children of affluent families were more likely to be stay back in
the house and kill time by watching television. These children also
had more chances to frequently visit fast food shops. Their parents
could afford the cost of fast foods and they were also fulfilled the
demand of their children if they had sufficient family income. It was
observed that the monthly family income of 38.2% families was
70 thousand and above taka [ Bangladesh currency] but 79.1 %
children of these families were in underweight group (Table 8). It
was seen that prevalence of obesity was higher among the children
of low-income group of families. This differential in observing
obesity was significantly different among the low-income group of
families [ χ2 = 53.06 with p-value = 0.00]. Family environment was
one of the correlates of obesity among children [16]. It seemed
that family environment was influenced by parents’ education and
occupation. Let us investigate how fathers’ and mothers’ education
were associated with children and adolescent’s obesity. It was seen
that (Table 9) the fathers of 77.9 % children were higher educated
and 75% children of them were underweight. The percentage of
illiterate fathers was 3.5 and 91% children of these fathers were
underweight. But obesity and severe obesity among children of
illiterate and primary educated fathers were more (8.7 and 17.4% respectively) compared to the children of secondary educated
(2.1%) fathers. The differential in proportions of level of obesity
and fathers’ educational level were highly significant [χ2 = 111.70
with p-value = 0.00]. Similar significant differentials in proportions
of obesity of children according to the differences of mothers’
education were also observed [Table 10 χ2 = 39.23 with p-value =
0.00].
Table 8: Distribution of children and adolescents according to their level of obesity and monthly Income.


Table 9: Distribution of children and adolescents according to their level of obesity and level of father’s education.


Table 10: Distribution of children and adolescents according to their level of obesity and level of mother’s education.

There were 5.1 percent agriculturists and 79.4 percent children
of them were underweight. The lowest underweight children were
observed in those families where father was engaged in profession
other that business and service. The maximum underweight children
were observed in the families where father was a serviceman. The
differential in proportions in different levels of obesity by father’s
occupation was significant [χ2 =67.281, p-value=0.000, Table 11].
However, mothers occupation had no impact on level of obesity of
children and adolescents [ χ2 =6.279, p-value=0.393, Table 12].
Table 11: Distribution of children and adolescents according to their level of obesity and levels of father’s occupation.


Table 12: Distribution of children according to their level of obesity and level of mother’s occupation.

Association between level of obesity and some social characters
were studied by chi-square test. Here impact of social variables
on obesity and prevalence of diabetes were not studied. It was
done in some other study [19]. However, the impacts of social
factors on prevalence of other diseases were studied. It was
done by fitting the logistic regression model assuming levels of
other diseases as dependent variable. The explanatory variables
used were residence, religion, age, parent’s education, parent’s
occupation, family income, food habit of children, utilization of
time by the children, blood sugar level of them and body mass
index. However, all the variables were not used in fitting the final
model because during observing model fitting criteria some
variables were found insignificant. These variables were age of
children, gender of children and parents’ occupation. The analytical
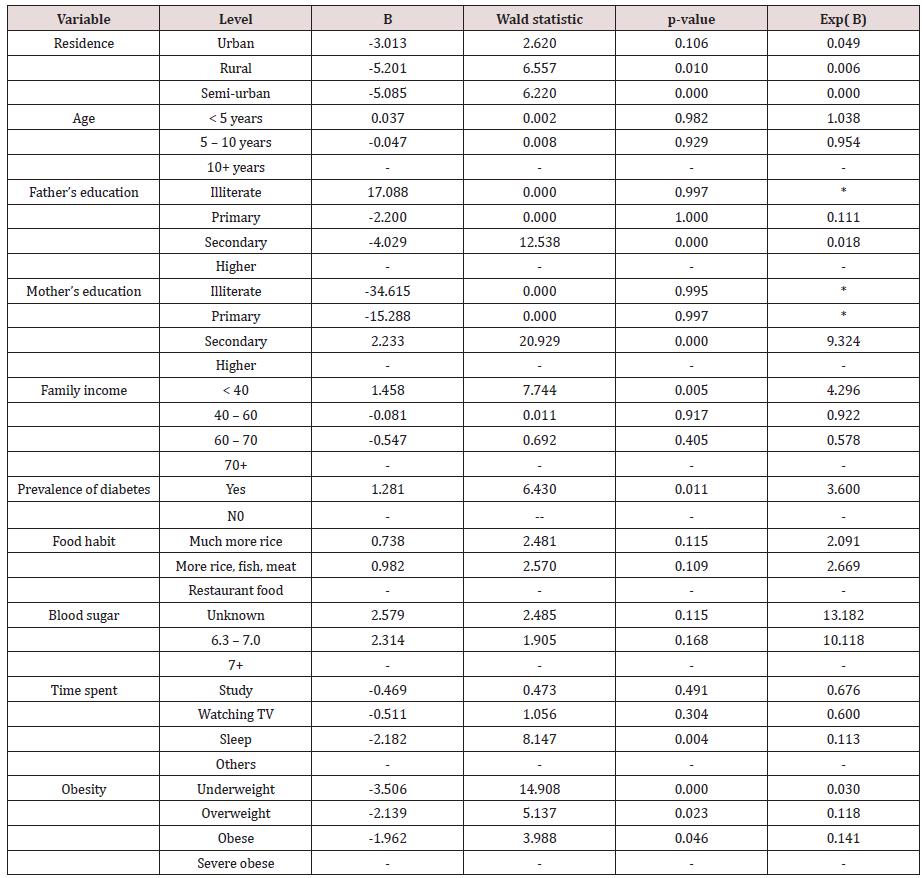
results were shown below: From the fitted model it was noticed
that prevalence of diabetes, level of obesity, and residence were
the responsible factors for the prevalence of other diseases. The
analysis was done considering no disease as reference factor Table
13. Thus, Model fitted results were available for the remaining 4
types of diseases. However, due to insignificant results in fitting
the model for the diseases like kidney problem, hypertension and
some other diseases the results were not presented. Results were
presented only for the disease eye problem. This problem was
prevailed among 7.6 percent respondents and this group was the
biggest (56.2 %) among the children and adolescents who were
experienced of different diseases. The fitted model was significant
as was observed by the statistic – 2loglikelihood =364.489 and the
corresponding χ2 = 1696.824 with p-value =0.000. The value of Cox
and Snell R2=0.923 and Nagelkerke R2= 0.961.
Conclusion
Problems of obesity are manifold. It is a life threating condition which can enhance diabetes, heart disease, cancer, liver disease, skin infection, asthma, and other respiratory problems [20,21]. Obese adolescents have increased chance of mortality during adulthood [22]. The problem also arises from the social environment. Hence, some measures need to be taken to control the problem. Government and school authority should introduce some regulations so that physical education is a compulsory cocurricular activity of the school. Parents can encourage their kids to avoid watching television and untimely sleeping and they can provide the quality school lunches. Kids should be provided fresh and healthy food and they should be accompanied to parks and to play field or walkways. They can be advised to avoid sedentary activities like use of mobile phone, computer, video games. Some of the steps of parents can prevent the alarming increase in the rates of obesity and severe obesity and in the rate of prevalence of diabetes and prevalence of other diseases.
For more Lupine
Publishers Open Access Journals Please visit our website:
http://lupinepublishers.us/
http://lupinepublishers.us/
For more Open Access Journal on diabetes and Obesity articles Please Click Here:
https://lupinepublishers.com/diabetes-obesity-journal/
To Know More About Open Access Publishers Please Click on Lupine Publishers
Follow on Linkedin : https://www.linkedin.com/company/lupinepublishers
Follow on Twitter : https://twitter.com/lupine_online


No comments:
Post a Comment