Diabetes and Obesity Open access Journals- Lupine Publishers

Introduction
Some of the data are age, height, weight, level of education, occupation, income, marital status, type of work, food habit, smoking habit, prevalence of obesity, diabetes, hypertension, etc. The prevalence of obesity is the cause of non-communicable diseases like diabetes and hypertension and the sources of these two are occupation, work type, food habit, smoking habit. There may be other sources of diseases. But the sources mentioned here are categorical (qualitative) variable. The quantitative variable income, age, weight, etc. are also the sources of non-communicable diseases [2]. The data mentioned above are the multivariate data. The analytical procedures of these data are different, and the procedures are broadly classified as
a)Dependence Analysis
b)Interdependence Analysis.
One of the techniques of dependence analysis is the Discriminant Analysis. This analysis is used to discriminate the investigated units according to some categorical variable and to identify the most responsible variable(s) for the discrimination. Accordingly, the health planners can suggest the ways and means so that proper action can be taken to control the sources responsible for the health hazard in the society.
Discriminant Analysis
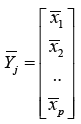
Let xij be the i-th variable observed from j-th category of units [ i = 1, 2, ……..p ; j= 1, 2, …., k], where
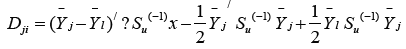
Su = Σ nj Sj / ( n – k ). Here nj = number of observation in j- th category, n = Σ nj.
The k category of units can be discriminated by
a)ML Method of Discrimination
b)Bayes Discriminant Rule and
c)Fisher’s Discriminant Rule.
The ML method of discrimination needs to calculate the following statistic
D12 + D23 = D13.
In such a situation the value of x will be allocated to a population as per the rule discussed below:
a) If D12>0 and D13>0, allocate x to the population -1
b) If D12<0 and D13>0, allocate x to the population -2
c) If D12<0 and D13<0, allocate x to the population -3.
The discriminant analysis is meaningful if the k mean vectors of variables are heterogeneous. For the analysis a model is considered when there are k = 2 groups, where the model is
D = B0 +B1 x1 + B2 x2 + …………. + Bp xp
Here Bi (i = 1, 2, ….,p) is the discriminant coefficient of the variable xi . The interpretation of these coefficients are closely follows the logic of multiple regression. The value Bi indicates the importance of the variable xi in discriminating between the two groups. For k=3 groups problem, one function is considered to discriminate between first group and combined second and third group. Another function is considered to discriminate between second and third group. The number of discriminant functions are (k – 1) if their k groups. In that case the interpretation of coefficients is made for each function separately. The coefficients are available using Statistical Packages. D is the discriminant score for different values of x when k=2. The correlation coefficient of discriminant score and the variable is used to decide an important variable for discrimination. The highest correlation coefficient indicates the most important variable for discrimination. Different functions may identify different important variables for discrimination.
Some Results of Discriminant Analysis
The following Discriminant Analysis was done [3] to discriminate 900 randomly selected adults of Bangladesh classified by levels of obesity. It was observed that levels of obesity were varied differently with the variation of different social factors. Thus, there were in search of identification of most important variables to discriminate the respondents according to various of levels of obesity. This was done by discriminant analysis. The analysis helps to identify the important variables for which the groups of respondents were significantly different [4]. The variables which were included in the analysis were sufficient to discriminate the different groups of respondents according to their level of obesity as Box’s M = 287.926 and the corresponding F= 1.403 with p –value = 0.000. The analysis provided 3 discriminant functions for 4 groups of respondents. The first function was significant as values of Wilk’s ∧ for first, second and third functions were 0.918, 0.973 and 0.994, respectively and the corresponding x2 values were 75.920( p-value=0.0000, 24.493 ( p-value=0.222) and 5.065 (p-value=0.829). The standardized canonical discriminant function coefficients were presented in Table 1. From the discriminant analysis the correlation coefficients of variables and the discriminant functions scores were calculated. These coefficients were shown in Table 2. The analysis indicated that the respondents of different levels of obesity were significantly different according to socio-demographic variables. The important variable for discrimination was residence followed by age. The other important variables were gender and marital status.
Table 1: Coefficients of functions.

Table 2: Pooled within group correlations between discriminating
variables and standardized discriminant function.

As a second example of discriminant analysis, 662 children
and adolescents of some randomly selected affluent families
were classified by their level of obesity [5]. There were 4 groups
of respondents and for these 4 groups the variables age of the
children, food habit of children, utilization of time by the children,
father’s education, mother’s education, father’s occupation,
mother’s occupation and family income were different and most
of them were associated with the level of obesity. Therefore, these
variables were included to discriminate the children. For 4 groups
of children 3 Fisher’s linear discriminant functions were available.
The coefficients of these functions for different variables were
shown in Table 3. First function explained 92.7% variation of the
children’s level of obesity and most important variable to explain
this variation is father’s occupation followed by mother’s education
and father’s education. This phenomenon was observed from pooled
within groups correlations between discriminating variables and
standardized canonical discriminant functions. The results of this
pooled within groups correlations were given in Table 4. The most
important variables identified by functions were shown by given
asterix. Since first functions explained 92.7% variation in level
of obesity and this function was statistically significant [ Wilk’s
Lamda=0.834, Chi-square =97.811, p-value=0.000], the pooled
within groups correlations were shown for this first function.
Some variables were also found important by second function to
discriminate children by level of obesity. However, the 2nd and 3rd
functions were not statistically significant and the pooled within
groups correlations of variables and 3rd function were not shown.
Table 3: Discriminant coefficients of different variables: (.
Indicates significant correlation).

Table 4: Correlation coefficients of variables with discriminant
score.

As a third example, let us present the results of discriminant
analysis when discrimination was done according to the prevalence
of non-communicable diseases [NCDs]. A group of adults of
Bangladesh was investigated [2] to identify the responsible variable
for the prevalence of NCDs. The data were recorded from randomly
selected 785 adult people of Bangladesh. Among them, 49.4 percent
were affected by at least one of the NCDs. The two groups of
respondents were discriminated to identify the factors responsible
for discrimination. The analysis indicated that the variables age,
followed by marital status and weight were the most important
variables in discriminating the two groups of respondents. The
analytical results were presented in Table 5. As a fourth example,
let us discuss the discrimination of students of public and private
universities in respect of some social characters. The number of
investigated students were 893 from private universities and 119
from public universities [6].
Table 5: Coefficient of discriminant function and pooled within
groups correlation between variables and discriminant function
score.

As there were two groups of students, viz. students of public
university and students of private university, one discriminant
function was derived. The function wasThis function was significant as Wilks Lambda is 0.773 [χ2= 258.758, p=0.000, Bartlett (1947)] and it indicated that the students of private and public universities were significantly different in respect of some of the socioeconomic characteristics. The important socioeconomic characteristics were identified by the canonical correlation coefficients of the variables and the discriminant score. The correlation coefficients are shown in Table 6 in descending order of magnitude. It is seen that father’s education is very important social factor to discriminate between student of private and public universities followed by mother’s education, residential origin and age of students. As a fifth example, let us discuss the discrimination of 900 randomly selected adults of Bangladesh [7] in respect of the prevalence of diabetes. There were two groups of respondents, one group of 635 diabetic patients and another group of 235 normal respondents. In doing the discriminant analysis, there was an attempt to decide the inclusion of variables in the discriminant analysis. For this the value 1- r2 was calculated and was shown in Table 7. Here r is the multiple correlation coefficient when one variable was considered as dependent variable and others as independent variable. None of these calculated values was low and hence all the nine variables were included in the analysis.
Table 6: Correlation coefficient between variables and
discriminant score in descending order of magnitude.

Table 7: Results showing the importance of inclusion of variable in the discriminant analysis.

The discriminant coefficients were shown in Table 8 below.
The results indicated that the variable residence had the highest
discriminating power followed by work type, income and age. The
importance of the variables was also observed from the study of
the correlation coefficients of the variables with discriminant score.
The correlation coefficients in descending order were shown below
in Table 9. The function was found highly significant by Bartlett’s
test (p<0.001). The test indicates that diabetic and non-diabetic
respondents were significantly different. The important variable
for discrimination was age followed by education and residence.
This result was observed from the study of correlation coefficient
of the variables and discriminant score. The same of respondents
were also discriminated by the type of disease. The total diabetic
patients were classified in to four classes, viz. patients of type I, type
II, type III diabetes and another group of 269 patients who were
ignorant about their type of diabetes. In the first three groups the
number of patients were 136, 215 and 19 respectively.
Table 8: Discriminant coefficients of different variables.

Table 9: Correlation coefficients with discriminant score.

Thus, the patients were classified into 4 groups and identified
the groups by 1, 2, 3 and 4 respectively. The multivariate analysis of
variance showed that the mean vectors of four groups of patients
by type were significantly different (Wilk’s ^ = 0.891, F= 2.715, p ≤
0.01The discriminant analysis also showed that the 3 discriminant
functions were significantly different ( p ≤ 0.01). The results
were shown in Table 10. The pooled within- groups correlations
between discriminating variables and the standardized canonical
discriminant functions were shown in Table 11. The first function
discriminated well among groups of patients and the variables age
and education were important to discriminate among patients of
different types of diabetes. The second function discriminated well
and the important variables for discrimination were occupation and
work type. The third function discriminated well among different
groups of patients of different types and the variables income,
residence and sex were very important to discriminate well.
Table 10: Discriminant coefficients of different variables.

Table 11: Correlation coefficients with discriminant score.

For more Lupine
Publishers Open Access Journals Please visit our website:
http://lupinepublishers.us/
http://lupinepublishers.us/
For more Open Access Journal on diabetes and Obesity articles Please Click Here:
https://lupinepublishers.com/diabetes-obesity-journal/
Follow on Linkedin : https://www.linkedin.com/company/lupinepublishers
Follow on Twitter : https://twitter.com/lupine_online


No comments:
Post a Comment